
pyinstrument
pyinstrument是一款python性能分析器,它通过记录程序执行过程中的堆栈记录来帮你找出程序最耗时的代码。pyinstrument每1毫秒中断一次程序,并在那一点记录整个堆栈,单个函数的执行时长会在函数执行结束后被记录。当你的python程序性能需要优化时,可以考虑使用pyinstrument来定位程序慢在哪里。
使用pip进行安装
pip install pyinstrument
1. 如何使用pyinstrument
在终端里运行 pyinstrument 命令, 得到如下结果
kwsy@zhangdongshengdeMacBook-Air:~/kwsy/coolpython$     pyinstrument
Usage: pyinstrument [options] scriptfile [arg] ...

Options:
  --version             show program's version number and exit
  -h, --help            show this help message and exit
  --load-prev=ID        Instead of running a script, load a previous report
  -m MODULE_NAME        run library module as a script, like 'python -m
                        module'
  -o OUTFILE, --outfile=OUTFILE
                        save to <outfile>
  -r RENDERER, --renderer=RENDERER
                        how the report should be rendered. One of: 'text',
                        'html', 'json', or python import path to a renderer
                        class
  -t, --timeline        render as a timeline - preserve ordering and don't
                        condense repeated calls
  --hide=EXPR           glob-style pattern matching the file paths whose
                        frames to hide. Defaults to '*/lib/*'.
  --hide-regex=REGEX    regex matching the file paths whose frames to hide.
                        Useful if --hide doesn't give enough control.
  --show=EXPR           glob-style pattern matching the file paths whose
                        frames to show, regardless of --hide or --hide-regex.
                        For example, use --show '*/<library>/*' to show frames
                        within a library that would otherwise be hidden.
  --show-regex=REGEX    regex matching the file paths whose frames to always
                        show. Useful if --show doesn't give enough control.
  --show-all            show everything
  --unicode             (text renderer only) force unicode text output
  --no-unicode          (text renderer only) force ascii text output
  --color               (text renderer only) force ansi color text output
  --no-color            (text renderer only) force no color text output
根据提示, 我们应该用pyinstrument命令来运行一个脚本
pyinstrument [options] scriptfile [arg]
我新建一个名为demo.py的脚本,内容较为简单
import requests
from pyinstrument import Profiler

def test_api():
    url = 'http://www.coolpython.net'
    res = requests.get(url)
    print(res.status_code)


profiler = Profiler()
profiler.start()

test_api()

profiler.stop()
print(profiler.output_text(unicode=True, color=True))
在这个脚本里,我想要详细记录函数test_api的执行过程,那么我需要在函数执行之前创建Profiler对象并启动它,在函数执行结束之后结束它,最后使用output_text方法输出调用栈的记录,由于我们在脚本里直接调用了output_text输出,因此可以直接使用python命令来运行程序
python3 demo.py
执行结果为
200

  _     ._   __/__   _ _  _  _ _/_   Recorded: 19:32:50  Samples:  10
 /_//_/// /_\ / //_// / //_'/ //     Duration: 0.447     CPU time: 0.013
/   _/                      v3.1.3

Program: demo.py

0.446 <module>  demo.py:1
└─ 0.446 test_api  demo.py:4
   └─ 0.446 get  requests/api.py:63
         [56 frames hidden]  requests, urllib3, http, socket, abc,...
            0.387 getaddrinfo  socket.py:728
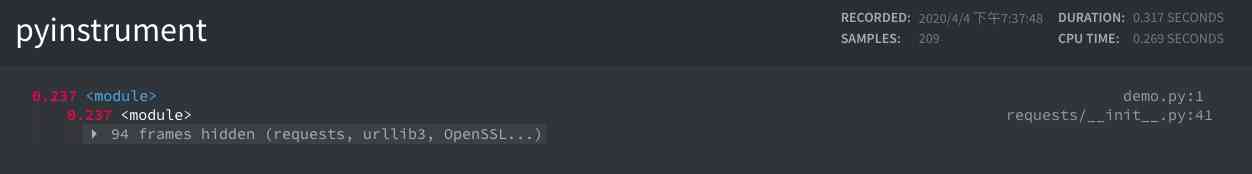
如果想获得更好的观察效果,或者对输出结果持久化保存,那么可以使用pyinstrument命令并配合适当的参数
pyinstrument --outfile=2.html -r html --hide=EXPR demo.py
这几个参数分别指定了输出文件和输出文件的类型,hide参数设置将调用过程中内置库的调用信息隐藏,最终得到的是一个html文件,打开后的效果如下
2. 配合flask使用
pyinstrument开发人员给了一份配合flask使用的示例代码
from flask import Flask, g, make_response, request
app = Flask(__name__)

@app.before_request
def before_request():
    if "profile" in request.args:
        g.profiler = Profiler()
        g.profiler.start()


@app.after_request
def after_request(response):
    if not hasattr(g, "profiler"):
        return response
    g.profiler.stop()
    output_html = g.profiler.output_html()
    return make_response(output_html)
before_request 会在视图处理请求前执行,after_request会在请求得到处理后返回结果前执行,如果请求的参数里包含了profile参数,表示需要记录整个调用栈的信息,当请求得到响应后,会调用output_html方法得到一个html页面,并将其返回,作者给的这个例子非常使用,但只适用于get请求,在浏览器里发出get请求,加入profile参数,就可以在浏览器里得到整个调用过程中调用堆栈的信息。
3. pyinstrument与profile(cProfile)有什么不同
按照作者的解释,Pyinstrument是一个统计分析器,而profile是跟踪分析器,Pyinstrument每隔1ms记录一次堆栈的情况,它不会跟踪程序进行的每个函数调用, 这样一来,系统开销就会小很多,以Django模板渲染进行测试,得到的结果如下
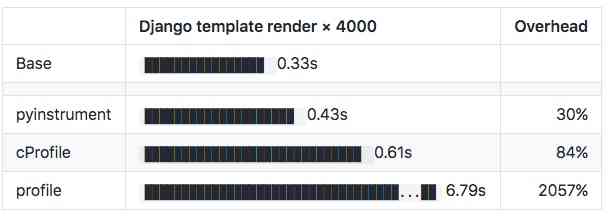
你可以看到,在使用pyinstrument时,仅仅比基础速度慢了30%, 而cProfile则慢了84%,cProfile 这类跟踪分析器由于大量调用探查器,可能会扭曲结果。
另一个不同在于,标准的python探查器获取了函数的执行时长,profile或者cProfile会根据每个函数的执行时长进行排序并展示,但是这些函数为什么会被调用,被谁调用等问题则不能给出令人满意的答案, 但pyinstrument会记录整个堆栈,因此可以完美的展示调用关系,并且会默认隐藏内置木块和标准库的调用信息。

扫描关注, 与我技术互动
QQ交流群: 211426309